Answers
Using a mask
Pair programming: part 2
Masking a galaxy
One application for using a geometrical mask, like you have been developing, is when looking at images containing real objects like galaxies. In this case we have accessed a galaxy image as a png file. In reality, there are more specific file formats traditionally used to store this type of astronomical data but the principle is similar.
We can open the image of the galaxy using the following code. This uses a module called pillow (imported as PIL) which understands how to read image files and we can import the Image sub-module to open this file. We can convert that image into a numpy array object.
If we look at the shape of this image data we can see that is is 3D - it has height and width but also three entries for colour: Red, Green and Blue (RGB).
As we did when plotting the mask, we can use a matplotlib function called imshow() to display this image, but this time it knows how to interpret the three colour channels to display an image with colour.
This is sprial galaxy NGC 253, also known as the Sculpter Galaxy. If we wanted to mask this image so that only the pixels related to the galaxy remain, we can do so using a geometrical mask for an ellipse - similiar to the circular mask you have been developing but with a few additional parameters needed.
Creating an elliptical mask
The inside_ellipse function defined below will allow you to check whether an (x, y) value is inside an ellipse with the supplied parameters. As we’ve seen in previous weeks, functions can be used to avoid having to repeat code.
Equations for an ellipse
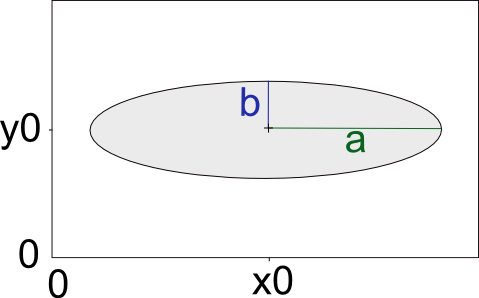
To understand the parameters that can be passed to the inside_ellipse() function we need to consider the form of an ellipse. The equation govering the edge of an ellipse is similiar to a circle but instead of one radius, \(r\), there are now two parameters \(a\) and \(b\) defined as the semi-major and semi-minor axes (naming can be the other way round depending on which is larger).
For an ellipse centred at (\(x_{0}\), \(y_{0}\)) and with the semi-major axis parallel to the x-axis the equation of the edge of the ellipse would be:
\[ \frac{(x-x_0)^2}{a^2} + \frac{(y-y_0)^2}{b^2} = 1 \]
This would look something like:
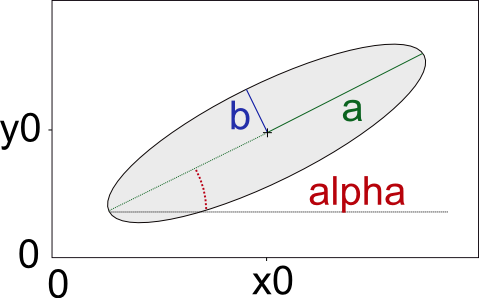
However, for our example we also need to consider an ellipse at an angle away from the x-axis, alpha (\(\alpha\)). The edge for this ellipse can be calculated using the full equation:
\[ \frac{((x-x_0)\cos\alpha + (y-y_0)\sin\alpha)^2}{a^2} + \frac{((x-x_0)\sin\alpha - (y-y_0)\cos\alpha)^2}{b^2} = 1 \]
This would look like:
The parameters needed to use inside_ellipse function are: the centre of the ellipse, the semi-major and semi-minor axes and the angle, \(\alpha\). For example:
Exercise B
For our example of the galaxy the parameters for a suitable ellipse are as follows:
- centre position \(x_0\), \(y_0\) at (500, 470)
- semi-major axis, \(a\), of 365
- semi-minor axis, \(b\), of 70
- angle alpha, \(\alpha\), of 38 degrees
- Use the
inside_ellipsefunction to create an elliptical mask which could be used to mask the galaxy image so only the galaxy is included. - Apply this mask to each of the (R, G, B) channels of the image
im(recall this is a 3Dnp.arrayobject). Call the masked imageim_masked.
As above, you can use the plotting code below which uses the matplotlib function imshow() to plot the 3D im_masked object as a colour image (or to plot a 2D image for one colour channel).
Calculating the magnitude
Now that we have masked out just the pixels related to the galaxy, one parameter we can derive is to calculate the galaxy brightness for a particular colour. Normally, this would not be done from an RGB image but we can use this to make an approximation.
The magnitude of an object is given by the equation:
\[ m_{AB} = -2.5\log_{10}(f_v) + 8.90 \]
where: - \(m_{AB}\) is the magnitude (on the AB scale) - \(f_v\) is the spectral flux density (in units of Jansky, \(Jy\))
Exercise C
We can calculate an approximation of the spectral flux density, \(f_{v}\), by summing the pixel values from our image and by applying a scale factor of \(2.8\times10^{-7}\).
From your masked image of the galaxy, and using the details above, calculate an approximation of the magnitude of the Blue channel (the third channel) from this image.
How does this compare to the true value for “B (AB)”? - available here: http://simbad.u-strasbg.fr/simbad/sim-id?Ident=NGC+253&jsessionid=262A420D60A8A4D72D3384528AA0980A.main
Hint: - Additional numpy functions which will be useful: - sum() - https://numpy.org/doc/stable/reference/generated/numpy.sum.html - log10() - https://numpy.org/doc/stable/reference/generated/numpy.log10.html